File:Arlington-avg-single-family-assessed-inflation-adjusted.png
Jump to navigation
Jump to search

Size of this preview: 800 × 504 pixels. Other resolution: 891 × 561 pixels.
Original file (891 × 561 pixels, file size: 37 KB, MIME type: image/png)
Summary
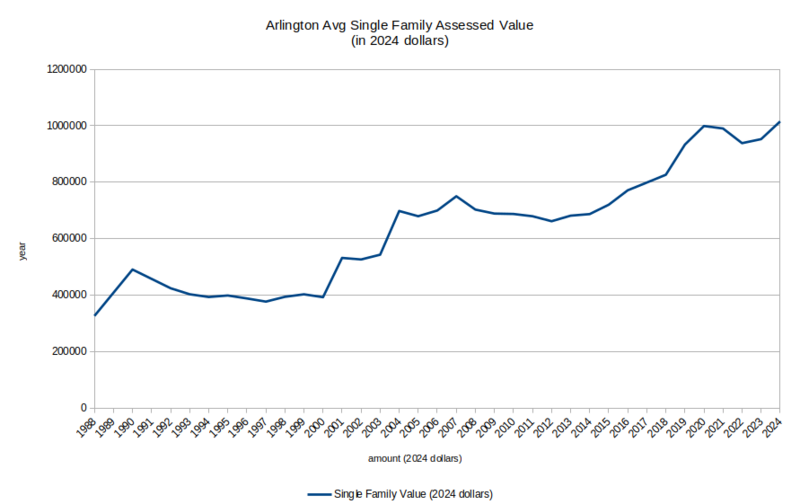
Chart showing the average assessed value of single-family homes in Arlington, MA, from 1988--2024. Data sourced from https://dlsgateway.dor.state.ma.us/reports/rdPage.aspx?rdReport=AverageSingleTaxBill.SingleFamTaxBill_wRange. Inflation adjusted values provided by https://www.bls.gov/data/inflation_calculator_inside.htm
File history
Click on a date/time to view the file as it appeared at that time.
| Date/Time | Thumbnail | Dimensions | User | Comment | |
|---|---|---|---|---|---|
| current | 13:33, 19 May 2024 | | 891 × 561 (37 KB) | SteveR (talk | contribs) | Chart showing the average assessed value of single-family homes in Arlington, MA, from 1988--2024. Data sourced from https://dlsgateway.dor.state.ma.us/reports/rdPage.aspx?rdReport=AverageSingleTaxBill.SingleFamTaxBill_wRange. Inflation adjusted values provided by https://www.bls.gov/data/inflation_calculator_inside.htm |
You cannot overwrite this file.
File usage
There are no pages that use this file.